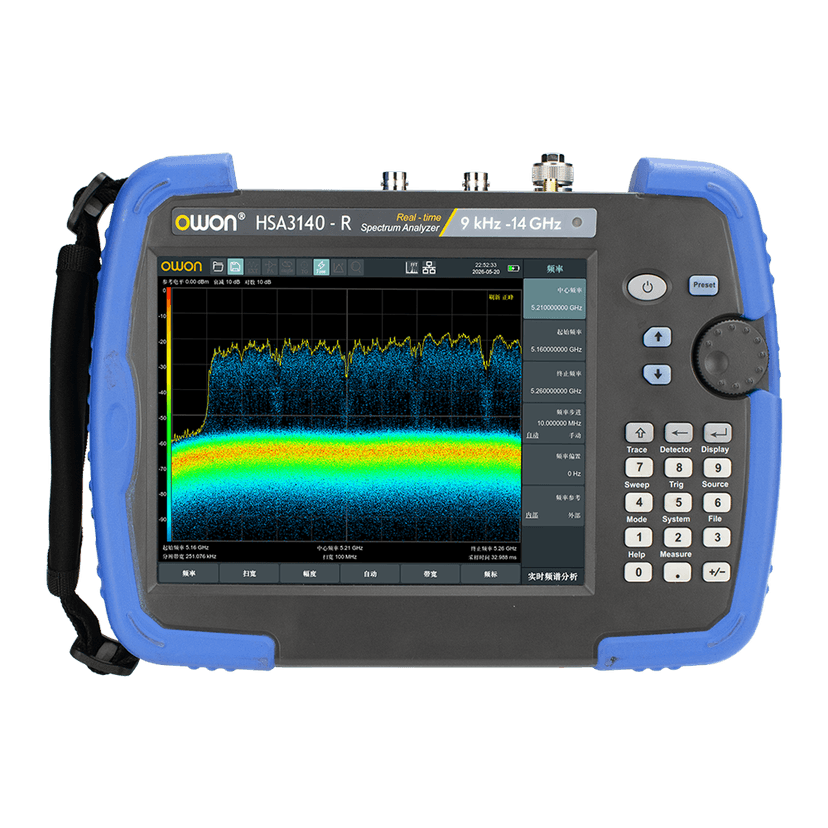
OWON HSA3000 Series 20 GHz Handheld Spectrum Analyzer
- Spectrum analysis from 9kHz to 20GHz
- 100MHz real-time analysis bandwidth
- 100% probability of intercept for signals as short as 6.25μs
- Displayed average noise level down to -165dBm/Hz
- 1Hz minimum resolution bandwidth
- Amplitude accuracy better than 0.7dB
- Optional vector network analyzer
- VNA measurements for S11 and S21
- Up to 90dB VNA dynamic range
- Optional cable and antenna measurement functions
- DTF, cable loss, insertion loss, return loss, and VSWR measurements
- GPS map, directional antenna, and gyroscope functions
- Optional EMI pre-compliance testing with 200+ standard templates
- Optional tracking generator
- Standard preamplifier support
- USB Type-C power input and power-bank support
- 8-inch IPS multi-touch display
- LAN, USB Device, and USB Host interfaces
- SCPI, LabVIEW, USB-TMC, VXI-11, and Socket remote control support
The OWON HSA3000 Series handheld spectrum analyzer provides four frequency configurations: HSA3036-R, HSA3075-R, HSA3140-R, and HSA3200-R, covering spectrum analysis ranges of 9kHz–3.6GHz, 9kHz–7.5GHz, 9kHz–14GHz, and 9kHz–20GHz respectively. The analyzer offers a minimum RBW of 1Hz, a displayed average noise level of -165dBm/Hz, and amplitude accuracy better than 0.7dB. Its 100MHz real-time analysis bandwidth enables detection of short-duration signals with a 100% response for signals lasting 6.25μs. Optional VNA functionality is available on applicable models and supports vector S11 and S21 measurements, with results including return loss, insertion loss, phase, group delay, VSWR, Smith charts, and polar plots. Optional cable and antenna measurements provide DTF, cable loss, insertion loss, return loss, and VSWR testing. For field applications, GPS mapping, directional antenna, and gyroscope functions can be used to record test location, route, signal strength, and antenna direction. EMI pre-compliance testing is also available with more than 200 built-in standard templates and custom templates.
| Model | Spectrum Analysis | VNA Frequency | Cable/Antenna Test | Tracking Generator Range |
|---|---|---|---|---|
| HSA3036-R | 9kHz–3.6GHz | 100kHz–3.6GHz | 100kHz–3.6GHz | 100kHz–3.6GHz |
| HSA3075-R | 9kHz–7.5GHz | 100kHz–7.5GHz | 100kHz–7.5GHz | 100kHz–7.5GHz |
| HSA3140-R | 9kHz–14.0GHz | Not specified | Not specified | Not specified |
| HSA3200-R | 9kHz–20.0GHz | Not specified | Not specified | Not specified |
| Spectrum Analysis | Frequency Range | 9kHz–3.6GHz / 7.5GHz / 14GHz / 20GHz, depending on model |
| Resolution Bandwidth | 1Hz–5MHz | |
| Displayed Average Noise Level | -165dBm/Hz | |
| SSB Phase Noise | <-106dBc/Hz; HSA3200-R: <-100dBc/Hz | |
| Third-Order Intercept | +14dBm | |
| Amplitude Accuracy | <0.7dB | |
| Real-Time Analysis | Real-Time Analysis Bandwidth | 100MHz |
| Dynamic Range | 60dB | |
| Minimum Signal Duration for 100% Response | 6.25μs | |
| Real-Time Spectrum Views | Probability density spectrum, waterfall, 3D spectrum, power vs. time | |
| VNA | Measurement Parameters | Vector S11, vector S21 |
| Dynamic Range | 90dB | |
| Display Modes | Reflection/transmission coefficient, return/insertion loss, phase, group delay, log magnitude, fault location, linear magnitude, real part, imaginary part, VSWR, Smith chart, polar plot | |
| Cable & Antenna Testing | Measurement Functions | DTF, 1-port cable loss, 2-port insertion loss, return loss, VSWR |
| Advanced Measurements | Measurements | CHP, ACPR, OBW, CNR, Harmonic, Monitor, CCDF, SEM, TOI |
| Modulation Analysis | Vector Signal Modulation | AM, FM, PM |
| EMI | EMI Filters | 200Hz, 9kHz, 120kHz, 1MHz |
| Detectors | Positive peak, RMS average, quasi-peak | |
| EMI Measurement | 200+ built-in standard templates and custom templates | |
| Communication | Interfaces | LAN, USB Device, USB Host |
| Remote Control | Protocols | SCPI, LabVIEW, USB-TMC, VXI-11, Socket |
| Remote Controllers | NI-MAX, Web Browser, Spectrum Vision software | |
| Display | Display | 8-inch IPS multi-touch screen |
| Input Support | Mouse and keyboard | |
| Power | Power Input | USB Type-C; supports power banks |
| Mechanical | Dimensions | 270mm × 190mm × 60mm |
| Operating Conditions | Warm-Up | At least 30 minutes before use |
| Calibration | Calibration | Instrument must be within calibration cycle and have undergone self-calibration |